KMEANS CLUSTERING CUSTOMER SEGMENTATION PROJECT - PYTHON (SEE FULL PYTHON CODE here)
Introduction
Customer segmentation is a crucial task for businesses aiming to understand their customer base better and tailor their marketing strategies accordingly. In this project, I utilized the K-means clustering algorithm to segment customers based on their purchasing behavior.
This project is a step-by-step walkthrough of the process used in implementing KMeans Clustering for an online retail shop. Using the pandas library, the dataset was imported to Pyhton (in Visual Studio Code) and found to contain 525,462 rows of data and 8 field columns.
A GLIMPSE AT DATASET

What is K-Means Clustering?
K-means clustering is an unsupervised machine learning algorithm used to partition a dataset into K distinct, non-overlapping subsets (or clusters). The algorithm works iteratively to assign each data point to one of K clusters based on the features provided. The goal is to minimize the variance within each cluster.
Libraries Used
For this project, I used the following Python libraries:
- pandas: For data manipulation and analysis.
- matplotlib and seaborn: For data visualization.
- scikit-learn: For implementing the K-means clustering algorithm.
Data Preprocessing
Before applying the K-means algorithm, I performed several data preprocessing steps:
- Handling Missing Values: I used pandas to fill or drop missing values.
- Removing Duplicates: Ensured there were no duplicate entries in the dataset.
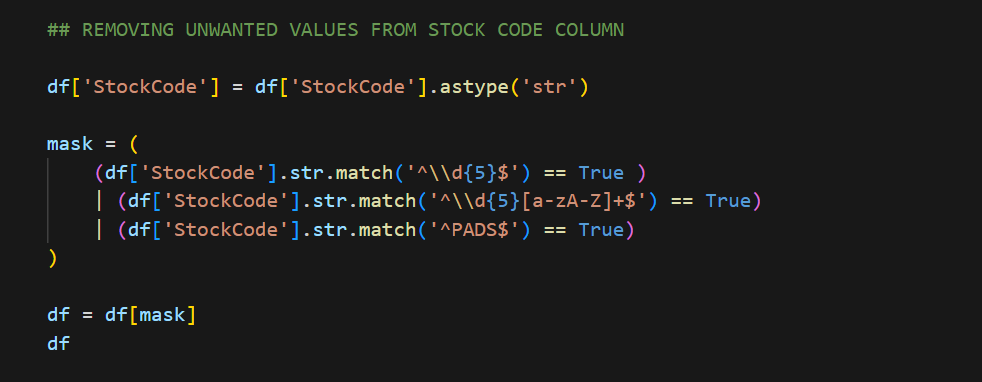
- Standardizing Data: Removing all the unnecessary data and working with values that only has significance
- Feature Scaling: Standardized the features to have a mean of 0 and a standard deviation of 1 using StandardScaler from scikit-learn.
A GLIMPSE AT DATA CLEANING PROCESS

Implementing KMeans Clustering
The K-means algorithm was implemented using the KMeans class from scikit-learn. Here are the key steps:
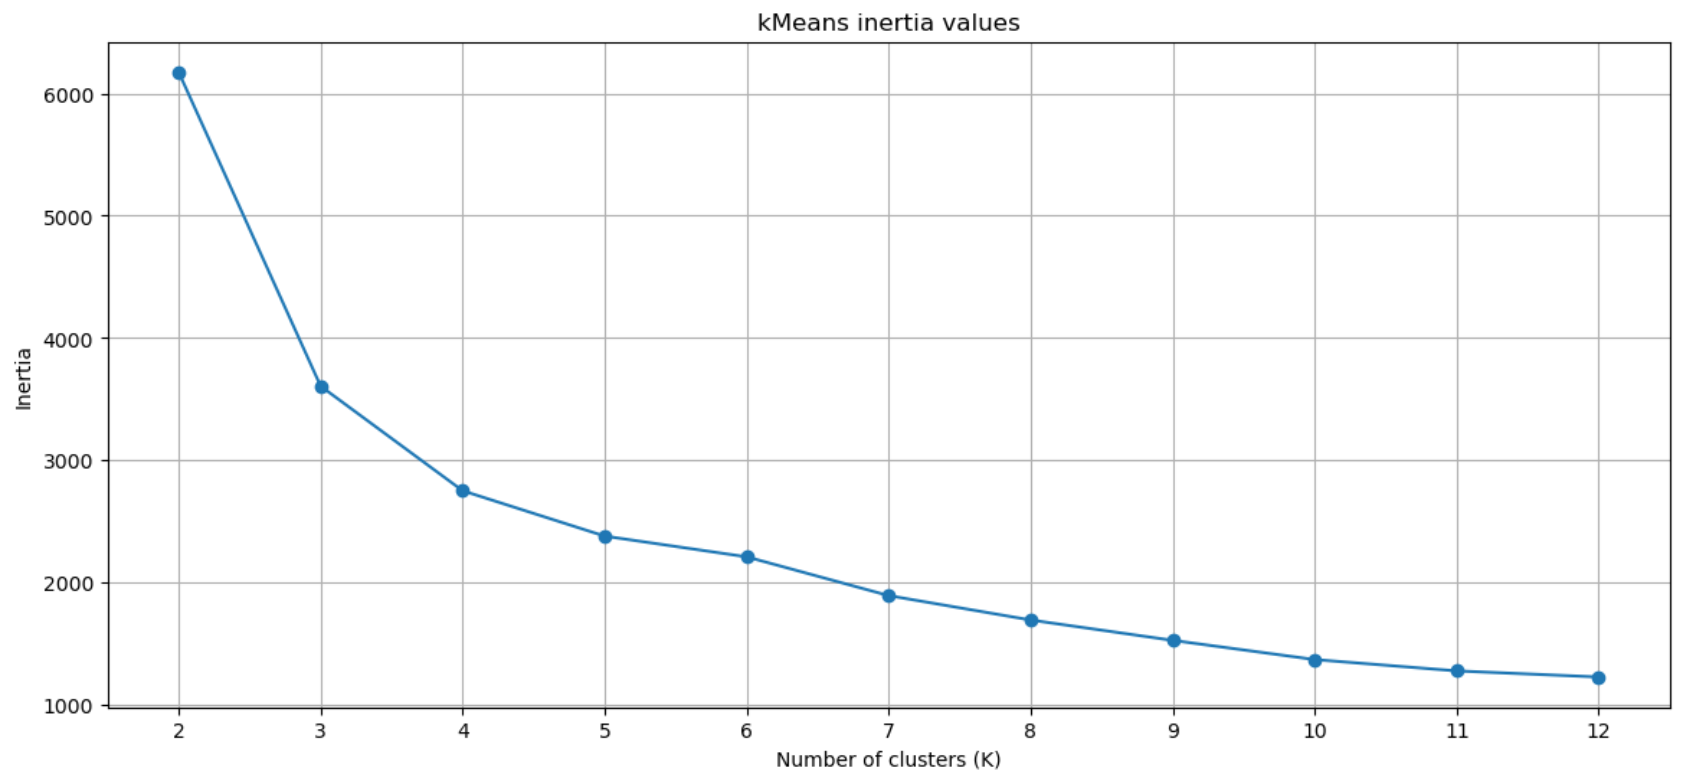
- Choosing the Number of Clusters (K): I used the Elbow Method to determine the optimal number of clusters. This method involves plotting the within-cluster sum of squares (WCSS) against the number of clusters and looking for an “elbow point” where the rate of decrease sharply slows.
- Fitting the Model: I fitted the K-means model to the preprocessed data.
- Assigning Clusters: Each customer was assigned to a cluster based on their purchasing behavior.
ELBOW METHOD TO CHOOSE NUMBER OF CLUSTERS

Identifying Outliers:
Outliers in any dataset can hamper the true results and can make analysis weaker. Therefore outliers were identified in the dataset using statistical methods and Box-plot visualization, and then separated to ensure the clustering algorithm performed optimally. Analysis were performed then on two datasets one with no outliers data and one of outliers data.
A GLIMPSE AT BOX-PLOT

ANALYSIS:
As per the dataset 3 key features of customer purchasing behavior were identified:
- Monetary Value: This variable represents the total amount one individual has spent in purchasing from the store.
- Frequency Value: This variable represents the number of times one individual has purchased from the store.
- Recency: This variable represents the last date individual had made a purchase from the store.
NUMBER OF CLUSTERS
As per the elbow method and analyzing the graph 4 number of clusters were chosen to perform the analysis. The 4 clusters were then set in dataframe and used to perform KMeans clustering for the 3 variables.

VISUALIZATION:
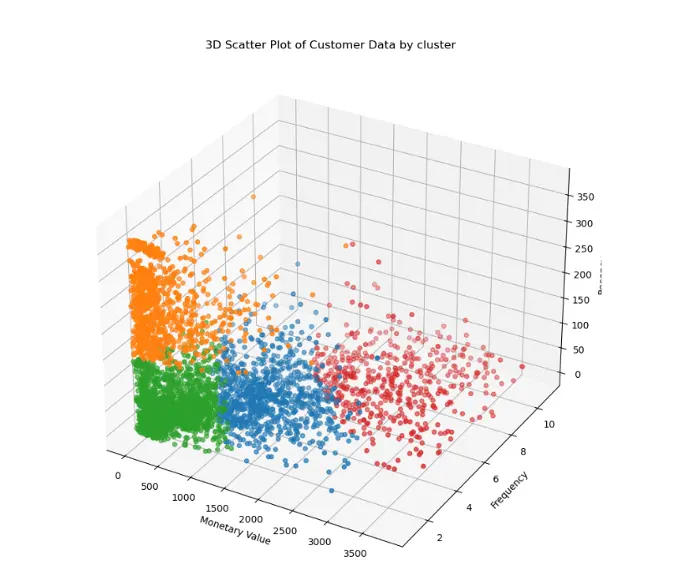
To visualize the clusters, I used scatter plot. The clusters were plotted in a 3D space using the first two principal components obtained from PCA (Principal Component Analysis) for better visualization. The 4 clusters were assigned different colors for better visualization and better interpretation.
RESULTS:
The K-means clustering algorithm segmented the customers into distinct groups. Here are some insights from the clusters:
- Cluster 0 (BLUE): Regular Buyers with moderate monetary values and high frequency
- Cluster 1 (Orange): Buyers with moderate frequency but have not purchased since long
- Cluster 2 (Green): New Buyers less monetary value
- Cluster 3 (Red): Buyers with very high monetary value and high frequency
A GLIMPSE AT SCATTER PLOT

CONCLUSION:
This project demonstrated the effectiveness of K-means clustering in segmenting customers based on their purchasing behavior. The insights gained from this segmentation can help businesses tailor their marketing strategies and improve customer satisfaction.
Click to view full python code here
A GLIPMSE AT CUSTOMER SEGMENTATION
