RETAIL STORE SALES ANALYSIS POWER BI
Introduction:
In this project, I created an interactive Power BI report for a retail store to analyze its sales data. The report is divided into three pages: Sales Overview, Sales by Market, and Year-wise Sales Analysis. This comprehensive report provides valuable insights into the store’s sales performance, helping stakeholders make informed business decisions.
Data Source:
The data for this project is available on Kaggle. The dataset included information such as sales transactions, product details, market segments, and time periods.
Data Preparation:
Before creating the report, I performed several data preparation steps to ensure the data was clean and ready for analysis:
- Data Extraction: Imported the sales data into Power BI.
- Data Cleaning: Removed duplicates, handled missing values, and standardized data formats.
- Data Transformation: Transformed the data into a suitable format for analysis, including creating calculated columns and measures.
Report Pages
1. Sales Overview:
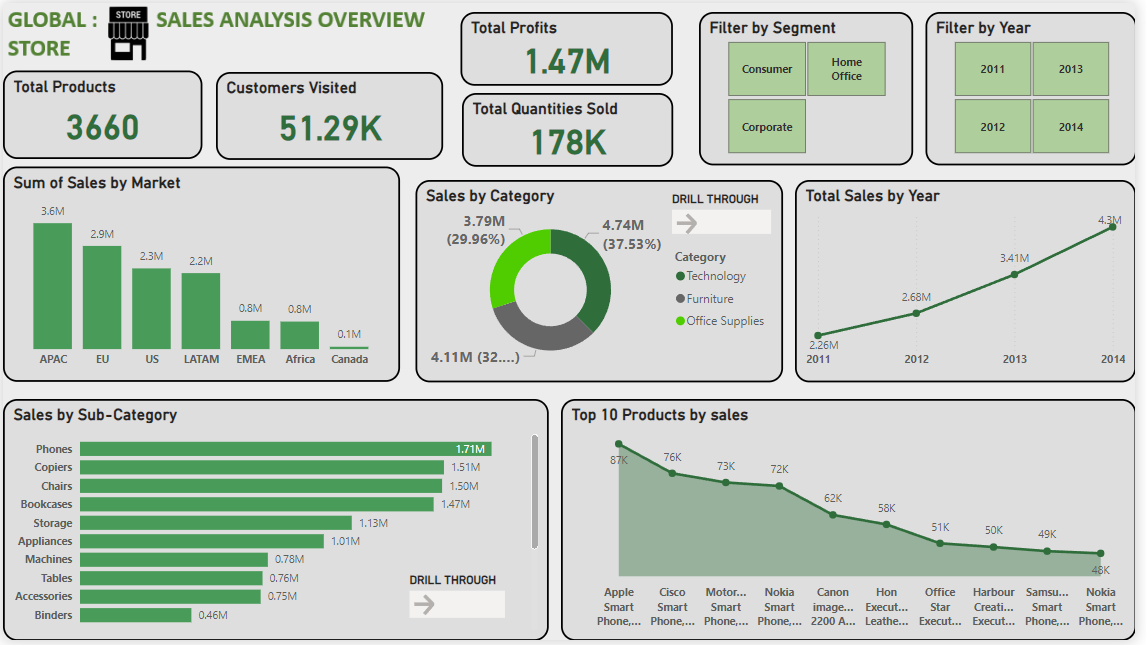
The Sales Overview page provides a high-level summary of the retail store’s sales performance. Key features include:
- Total Sales: A card visualization showing the total profits amount.
- Sales by Category: A pie chart displaying sales by product category.
- Top Products: A line chart listing the 10 top-selling products.
- Sales Trend: A line chart showing the sales trend over time.
SALES OVERVIEW PAGE

2. Sales by Market:
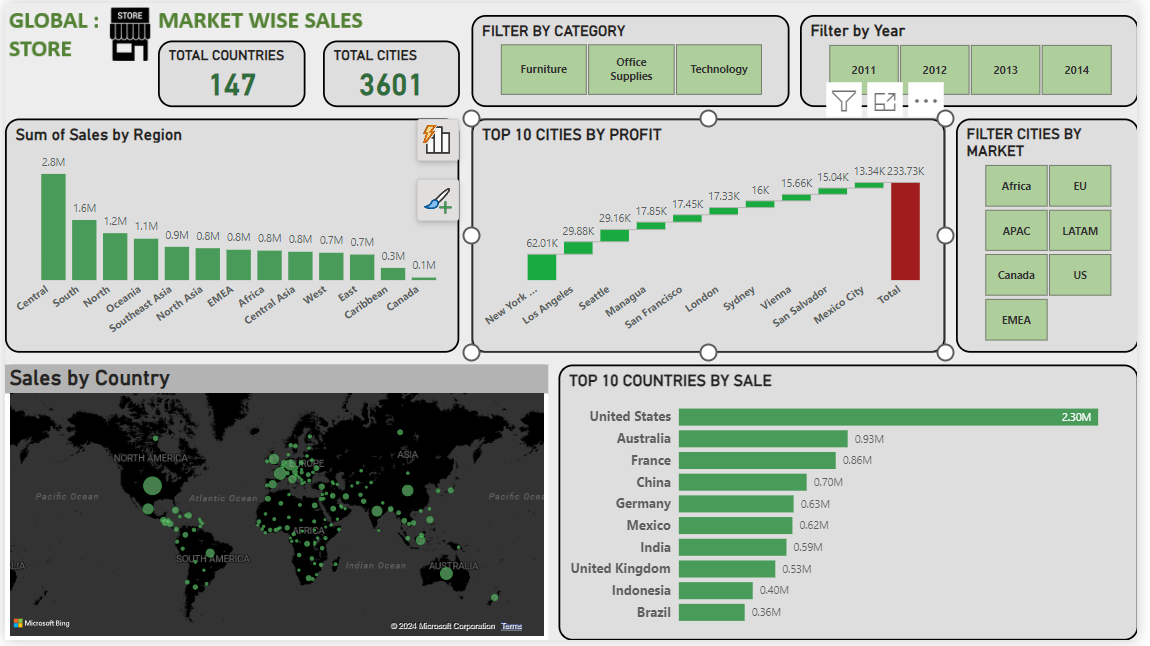
The Sales by Market page analyzes sales performance across different market segments. Key features include:
- Sales by Region: A map visualization showing sales distribution across different regions.
- Market Segment Analysis: A column chart displaying sum of sales by region
- Top Markets: A waterfall chart displaying top 10 cities by profit.
- Filter flexibility: A slicer to see details by specific market, year and category.
SALES BY MARKET OVERVIEW PAGE

3. Year-wise Sales Analysis:
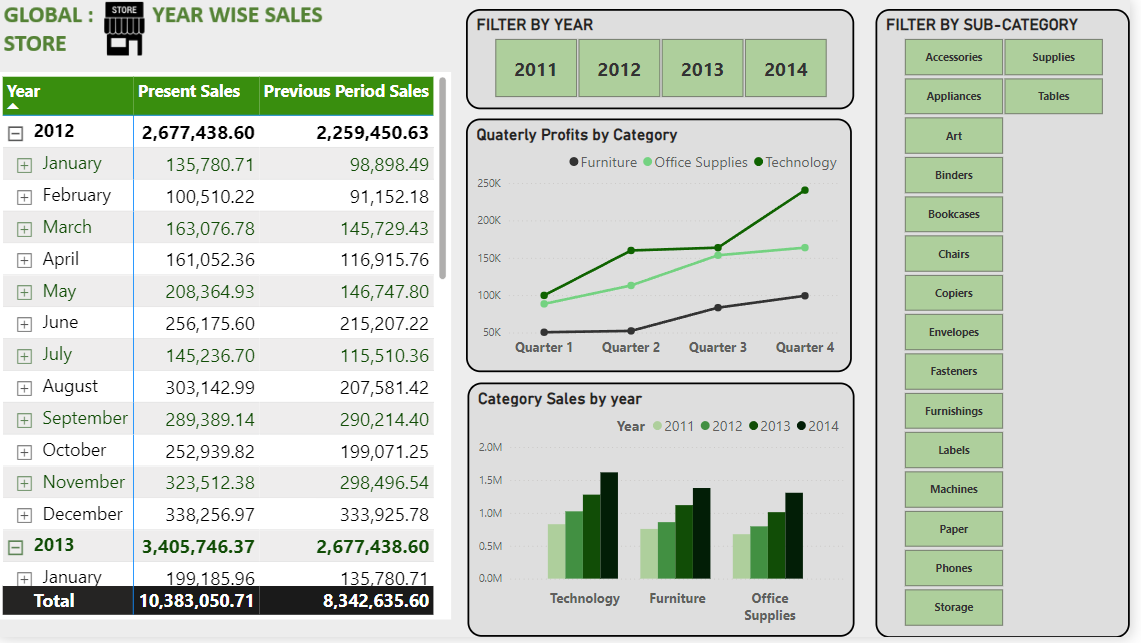
The Year-wise Sales Analysis page provides a detailed analysis of sales performance over different years. Key features include:
- Yearly Sales: A column chart showing total sales for each year as per the category.
- Sales Growth: A line chart displaying quarter by quarter sales.
- Monthly Sales Breakdown: A matrix showing sales distribution across different days, months and years.
- Filter flexibility: A slicer to see details by specific year and sub-category.
SALES BY YEAR OVERVIEW PAGE

Advanced DAX Functions:
To enhance the analysis, I used several advanced DAX functions in Power BI:
- CALCULATE: To create dynamic measures that change based on the context of the report.
- FILTER: To filter data based on specific conditions.
- TIME INTELLIGENCE: Functions like TOTALYTD and SAMEPERIODLASTYEAR to analyze trends over time.
- USERELATIONSHIP: To calculate sales by ship date.
Drill-Through Function:
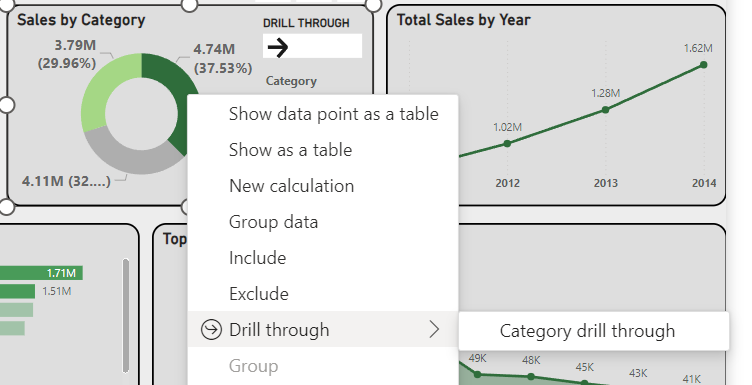
To enable deeper analysis, I added the drill-through function to the report. This feature allows users to select a data point and click on the drill through button on the visualization and navigate to a detailed report page that provides more granular insights. For example, users can drill through from a high-level sales overview to a detailed view of sales by a specific product or sub-category. Drill through function is added on two visualization in the report. One on pie chart showing sales by category in Sales Overview page and other on bar chart showing sales by sub-category also on sales overview page.
A GLIMPSE OF DRILL THROUGH

Conclusion:
This retail store sales analysis report demonstrates the power of Power BI in transforming raw sales data into meaningful insights. By leveraging advanced DAX functions, interactive visualizations, and the drill-through function, I was able to create a comprehensive report that provides valuable insights into the store’s sales performance. This project highlights the importance of data visualization in understanding and analyzing complex datasets, ultimately helping stakeholders make informed business decisions.