SPOTIFY REPORT USING POWER BI
Introduction:
In this project, I created an interactive report using Power BI to analyze Spotify data. The report provides insights into various aspects of music streaming, such as popular tracks, artists, genres, and user listening habits. Power BI’s powerful data visualization and analysis capabilities made it an ideal tool for this project
The dataset included details such as track names, artist names, genres, popularity scores, and timestamps of when tracks were played.
Data Preparation:
Before creating the report, I performed several data preparation steps to ensure the data was clean and ready for analysis:
- Data Cleaning: Removed duplicates, handled missing values, and standardized data formats using pandas.
- Data Transformation: Transformed the data into a suitable format for analysis, including creating calculated columns and measures.
Key Features of the Report:
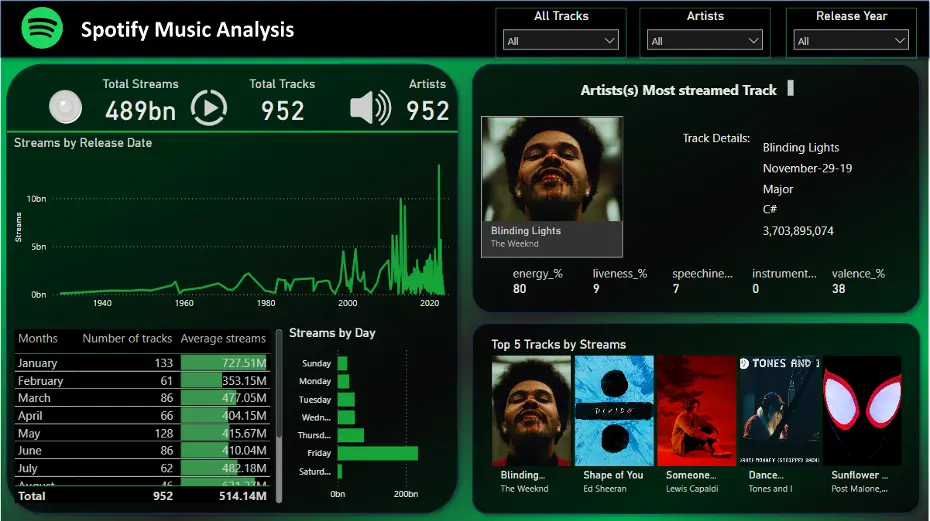
The Spotify report includes several key features and visualizations to provide a comprehensive analysis of the data:
- Top Tracks and Artists:
- Top Tracks: A card showing the most played tracks.
- Top Artists: A card displaying the most played artists.
- Listening Habits:
- Streams by day: A bar chart showing the number of tracks streamed over different days.
- Track Popularity:
- Popularity Scores: A new slicer showing the top 5 tracks by stream.
- Artists most played track: Analyzing the artist's most played track on new slicer.
A GLIMPSE AT SPOTIFY REPORT

Conclusion:
This Spotify report project demonstrated the power of Power BI in transforming raw data into meaningful insights. By leveraging interactive visualizations, I was able to create a comprehensive report that provides valuable insights into music streaming habits with various filtering capabilities. This project highlights the importance of data visualization in understanding and analyzing complex datasets.